


Track Record
Year 2000 marked the beginning of a secular bear market that we think will last for another 10 or 15 years. Because at that time we believed a bear market was being born, we protected our Model Portfolio with gold and gold shares.
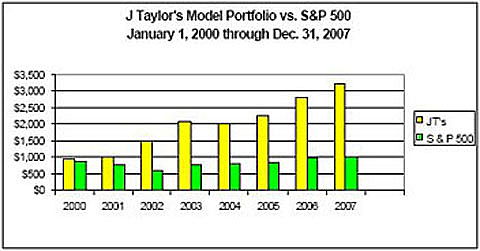
As the chart above to your left demonstrates, our policy of adding gold to our portfolio has greatly benefited subscribers who followed our lead. From January 1, 2000 through December 31, 2007, $1,000 invested in our hypothetical Model Portfolio would now be worth $3,183.76 while that same amount put into the S&P 500 would have been worth only $999.33. And that is before factoring out lost purchasing power due to inflation.
The secret of how gold can enhance long-term portfolio returns is a secret for a reason. Wall Street can't make nearly as much money if you opt out of their paper products into gold, so they don't tell you that when stock markets enter bear markets, you need to sell stocks and buy gold. The following chart illustrates how beneficial it is to buy gold and sell stocks at stock market peaks and to buy stocks and sell gold at equity bear market bottoms.
Note how at stock market bottoms, the Dow-to-gold ratio approached 1:1. However, at stock market peaks, gold became very inexpensive compared to stocks.
At the 1929 stock market peak, the Dow was at 300 and gold at $20.67, for a Dow-to-gold ratio of 14.5 times.
At the equity market peak in the mid 1960s, the Dow reached 959.26 and gold sold at $35, for a Dow-to-gold ratio of 27.4 times.
When the equity market bottomed in 1982, the Dow sold for 963.99 and gold sold at $594.92, leaving the Dow-to-gold ratio at 1.6 to 1. Actually the ratio fell below 1:1 in January 1980 when gold hit $850 and when the Dow was selling at below 800.
At the latest stock market peak, the Dow reached an all-time high of 14,198.10, but if we take the December 1999 close for the Dow, it was at 11,487.12. Gold at that time was selling for $283.22, leaving the Dow-to-gold ratio at 40.55 times.
On December 31, 2005, the Dow closed at 10,717.50. Gold closed at $516.78, leaving the Dow-to-gold ratio at 20.77 times. Whether the Dow bottoms at 5,000 and gold at $5,000 or the Dow at 2,000 and gold at $2,000, we can't hazard a guess. All we know is that based on history, the pendulum still has a long way to go in favor of gold and against the stock market at large.
Our conclusion: With Dow-to-gold ratio at historical levels, the bear market in stocks, as measured by the Dow-to-gold ratio, is still fairly young. As such, you can do much to preserve wealth by selling stocks and buying gold and gold stocks. As our track record indicates, this strategy has enabled us to more than double the value you would have received if you had invested in stocks (S&P 500) rather than in our Model Portfolio.
Continue to the The Model Portfolio