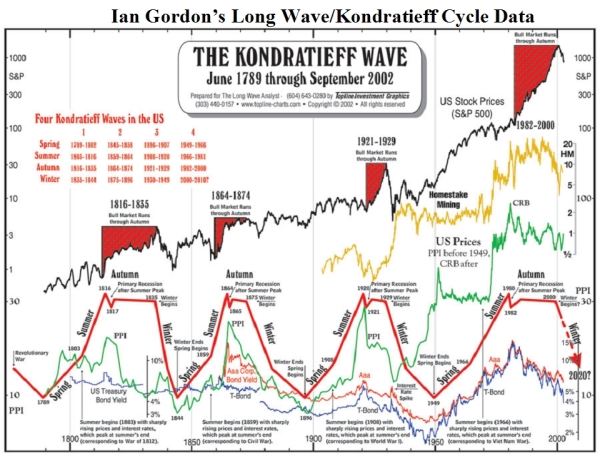
Slide #11 - Ian Gordon's Long Wave/Kondratieff Cycle data

This slide pictures real market data (stock market, U.S. Treasury Bond Yields, Producer Prices, and gold), some of which dates back to 1789. Being observed are rather symmetrical cycles of economic expansion and contraction. The contraction phase begins with a cycle-long peak in the equity markets. Policy makers apparently push the expansion as long as they can until the debt burden becomes so great that the system can no longer sustain it. With debt increasingly unpayable, the system has no choice but to break down into a deflationary implosion.
