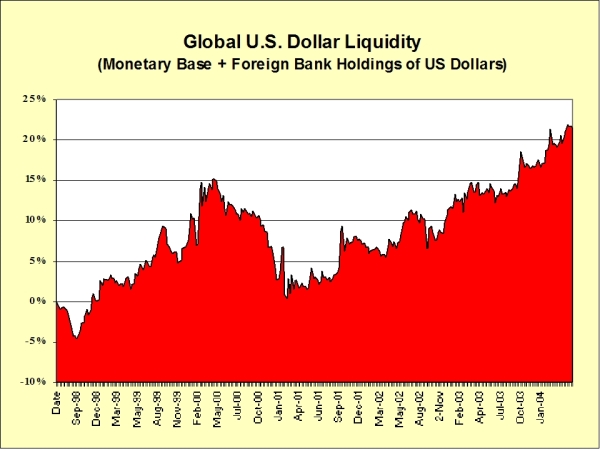
Slide #15 - Global U.S. dollar liquidity

The Asian crisis represented a brief flirtation with a deflationary collapse in Asia. In the midst of the Asian crisis, a prominent Merrill Lynch analyst talked about this statistic on CNBC. The Chart in slide 15 represents weekly data points that I gathered since late 1998, when the Asian Crisis was in full swing.
Global U.S. dollar liquidity measures the U.S. monetary base plus foreign bank holdings of U.S dollars. Frightened by the brief Asian flirtation with deflation, policy makers began to print money at a torrid pace, such that this measure of dollar liquidity peaked at a 52-week growth rate of slightly over 15% in about May of 2000.
Greenspan tapped on the brakes in an effort to slow down asset inflation and to keep the economy from facing problems from an asset bubble in s tocks. The result was the 80% crash in the NASDAQ. Note on the chart that year-over-year growth of this monetary aggregate approached zero in early 2001. At this point the Fed openly began talking about the prospects of deflation. The Fed's Ben Bernanke began talking about our modern printing presses and that if necessary the Fed could drop money from helicopters to keep the economy from entering into a deflationary collapse. And drop money from helicopters Mr. Greenspan and Mr. Bernanke have been doing. Global U.S. dollar liquidity is now growing at a pace in excess of 20% per year!
